
Have you ever wondered how the elements of a car dashboard were chosen? What now seems so logical, obvious and something we use without thinking about it was specifically designed and key elements were selected so we could monitor and evaluate the performance of our cars. Not only were they selected but at one point the manufacturers had to determine also how to display or visualize the key components: gas gauge, the speedometer, the odometer, seat belt warning light, etc. As early as 1930’s the Ford Model A had the beginnings of what we consider the modern dashboard.
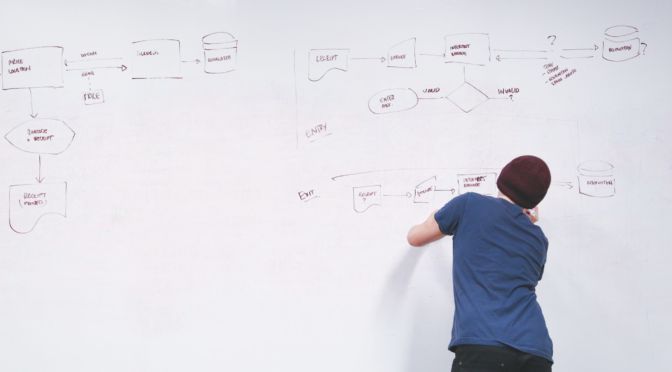
In the organizational development space dashboard has become a recent buzz word. Every organization wants one ─ needs one ─ to monitor their key activities, to make decisions and to demonstrate progress. However developing a dashboard, selecting the key elements to monitor, and determining how to visualize them is often a challenging process. What I see often when I have helped organizations think through this process are some common mistakes: (1) the organization tries to cram everything they measure or monitor into their dashboard; (2) the elements they have on their dashboard don’t help them make real-time program decisions; and (3) they don’t have the people or resources to update their dashboard regularly.
Getting started
To start designing your own dashboard it is best to first choose the purpose of your dashboard, I have found that the list of three common dashboards helpful:
- Operational dashboards tell you what is happening now
- Strategic dashboards track key performance indicators
- Analytical dashboards process data to identify trends
Next have a strategic meeting with your team and determine what you already measure or information you collect. Then determine the time period you need to look at this information to make critical decisions. Finally document your user and technical requirements to clearly record what you need and want from the dashboard.
Your user and technical specifications guided by the type of dashboard you see best-fit, you will be able to decide on which tool is appropriate for the dashboard development – a simple MS Excel Dashboard or more advanced type, such as Tableau or Power BI.
Data Innovator offers services in Data Process Mapping to guide your dashboard decision making, as well as Data Viz and Dashboard Development.
Author/s: Jerusha Govender
