We are currently living in the “fourth industrial revolution”. According to the World Economic Forum (WEF), it’s defined as the digital revolution in that there is an interaction of the physical, digital and the biological spheres.[1] Some of the implications of the digital revolution include more and more connectivity among people through mobile devices and the access to knowledge that has become unlimited.
It is predicted that by 2020 about five million jobs will be lost due to technology.[2] However alarming this may be, sectors such as education, public health among others will remain the same, and new job types are being created.
To remain relevant in the workforce it is important to understand what type of skills new job types will require. According to the WEF ‘Top 10 skills of 2020’, the top skill is complex problem solving and that has not changed since 2015. Also, one can see a shift of how creativity was deemed as number 10 in 2015 but then again in 2020 it will move to the top 3 on the list.
With a surge in information and data generation, your company/organisation will have (if not already) greater demands in generating insights and meaning. Even more so, the ability to creatively communicate data will enhance future problem solving and team innovation. Building data analysis, visualization and presentation skills – which form part of communication – have become useful and critical skills.
Good data communication empowers one to think creatively about that world and helps us think critically, in that way solve complex problems quickly. Data communication enables us to get clarity or answer questions through the visualization of data.
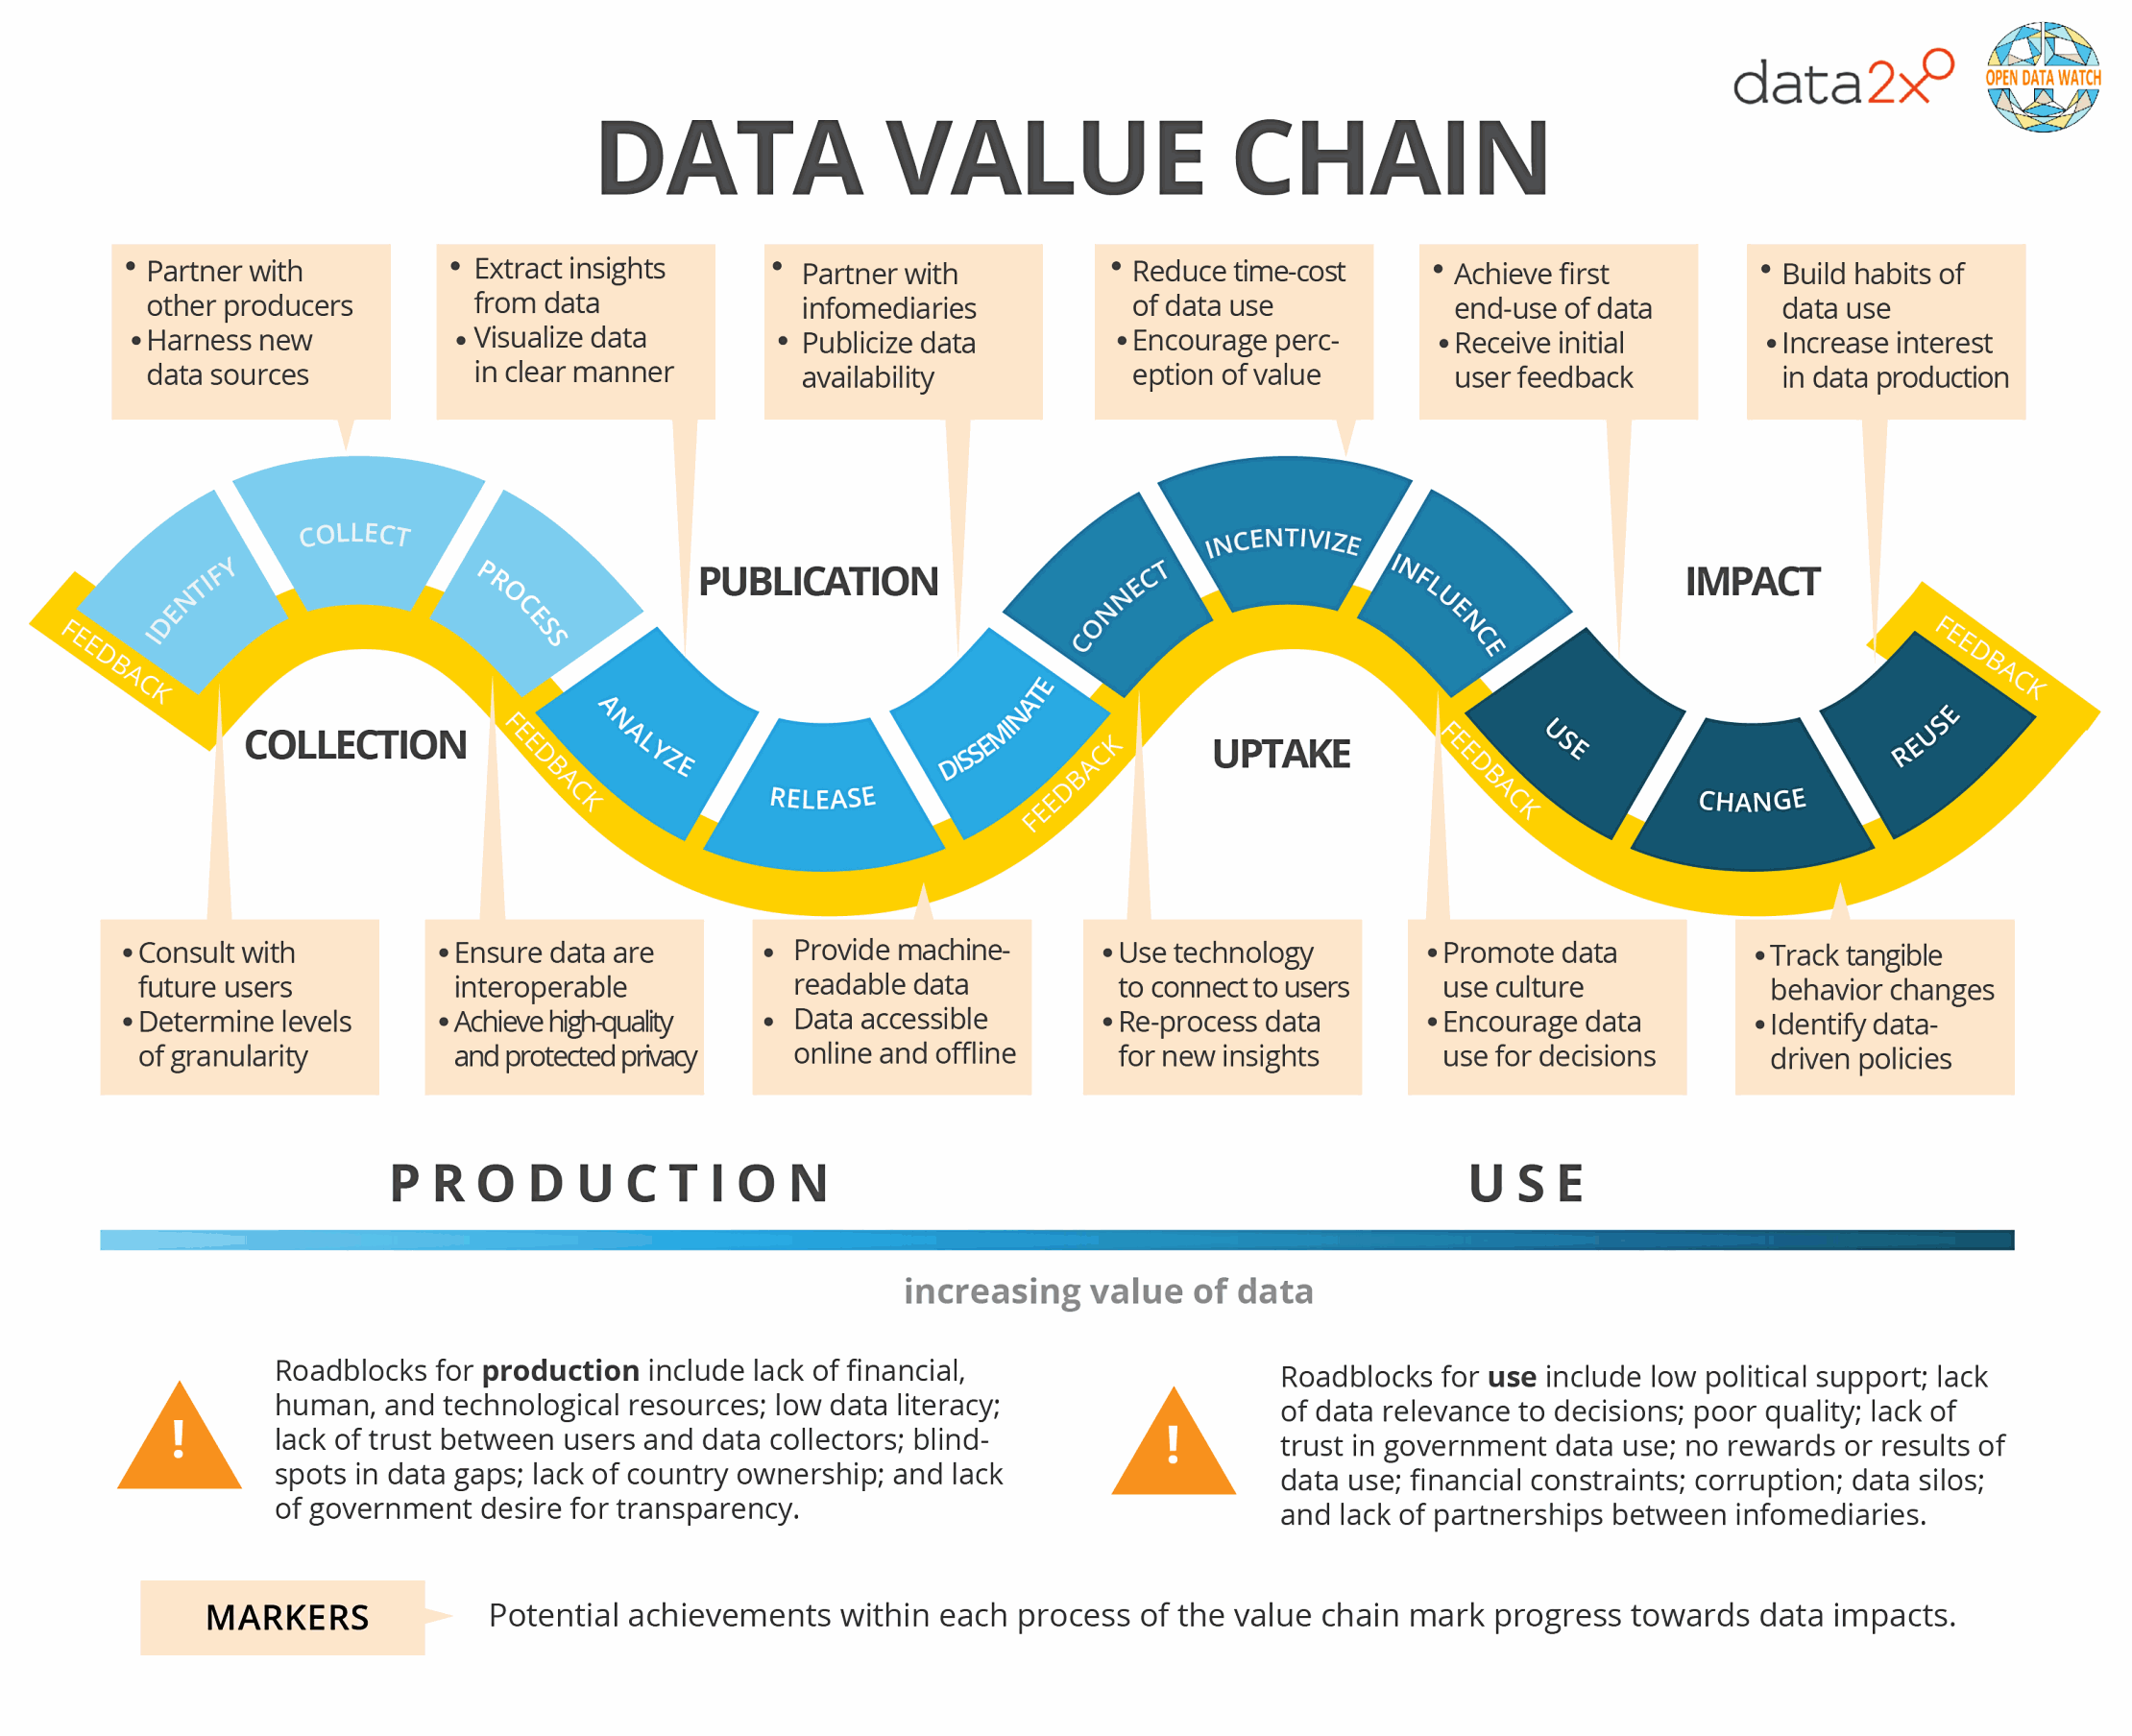
Data2X details the the complex journey of data as a Data Value Chain. The diagram of this chain highlights the various skills required at different points in the value chain.

Source: https://opendatawatch.com/wp-content/uploads/2018/03/Data_Value_Chain-WR-1803126.pdf
Who needs Data Communication skills?
There is a gap in Africa’s ‘home-grown’ data analysis, data viz and communication skills. Many companies today, hire experts who have visualization skills, to present data to managers, stakeholders, executives, donors, etc. We can agree that sometimes this is okay, but it’s time to strengthen your own or in-house skills as this becomes a frequented service.
Anyone who frequently presents reports, displaying results in the reports or anyone who generally enjoys learning with Excel, is likely the person in your team who has the potential and interest in building these skills.
As an individual, if you are applying for a position in business analytics, monitoring and evaluation or a related field, having data viz skills becomes a very valuable add-on to your CV.
Next week, we will share some resources to help you start building these skills.
Spark your data creativity: have a look at how we analysed and visualized masses of qualitative info from South Africa’s State of the Nation Transcripts, also check out the example of converting a 60+ evaluation report into a 2-pager infographic.
Authors: Tania Mazonde & Jerusha Govender
[1] https://www.weforum.org/agenda/2016/01/the-fourth-industrial-revolution-what-it-means-and-how-to-respond/
[2] https://www.weforum.org/agenda/2016/01/the-10-skills-you-need-to-thrive-in-the-fourth-industrial-revolution/


