[et_pb_section admin_label=”section”]
[et_pb_row admin_label=”row”]
[et_pb_column type=”4_4″][et_pb_text admin_label=”Text”]Author: Tania Mazonde
Data visualisation has played a vital role in how the Sustainable Development Goals (SDGs) have been presented. With the mass of data collated for the SDG indicators, the creative attempts are impressive. Since the adoption of the SDGs in 2015, countries have been incorporating the SDGs in their national development plans and monitoring and evaluation frameworks.
We investigated how organisations have attempted to present this info.
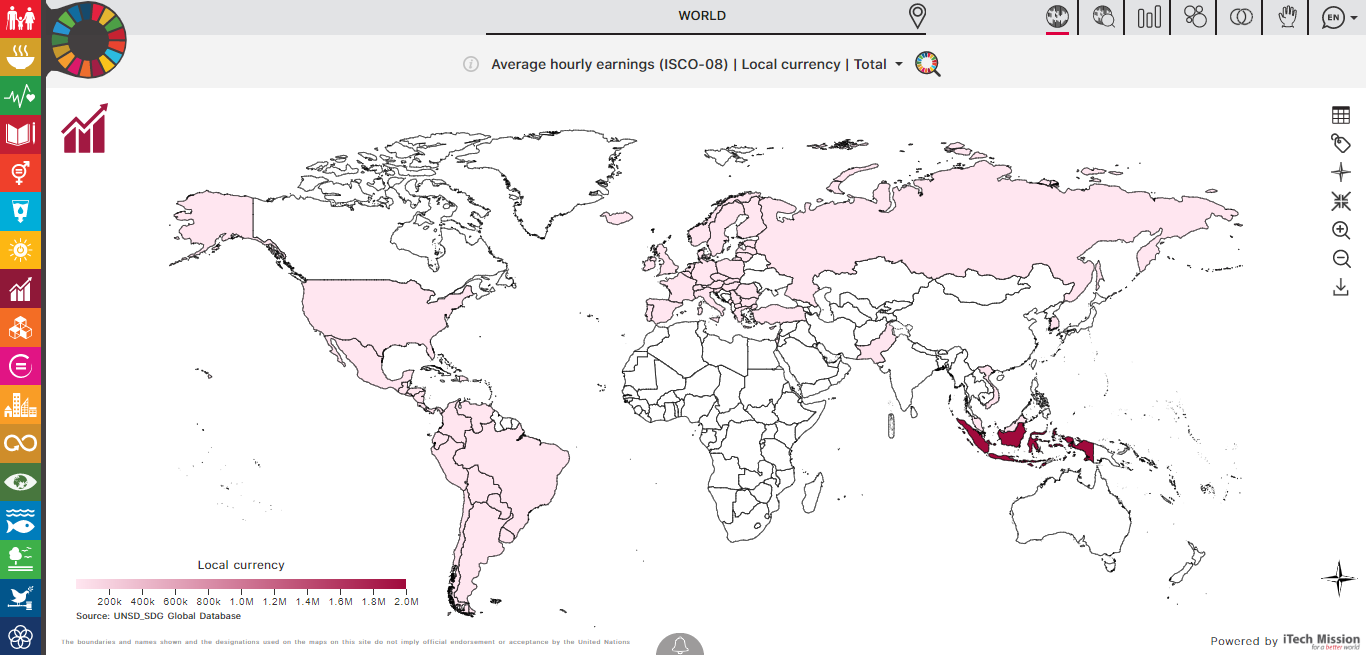
In 2018, iTech Mission launched an interactive SDGs Data Dashboard to monitor progress of these goals globally. The tool uses data derived from the UN Statistics Division’s (UNSD) SDG Global Database allowing its users to explore and analyse the data provided.[1] The dashboard includes different features such as the ability to link national statistics data and government data with the dashboard. This is an innovative dashboard created for the user to view the different indicators, by different levels such as number, percent, geographical location, total, and kilometres. Another feature that was added to this dashboard, was the user notification of updated data or when suggested data has been added into the dashboard.
Source: http://www.sdgsdashboard.org/
In Colombia, an interactive tool was developed that helps stakeholders make sound and quick decisions regarding a country’s progress on the SDGs. This framework and tool help visualize the interactions between the different SDGs and helps track a country’s progress and identify actions in order to complete the goals.[2] However, this tool and framework is solely designed for Colombia. This framework and tool works using a 7-point scale to score SDGs interactions[3]. The analysis is completed using network analysis that determines which interactions are positive or negative. This provides a summarised view of the key goals of the results in an online matrix.
Source: https://www.sei.org/featured/visualize-sdg-interactions-colombia/
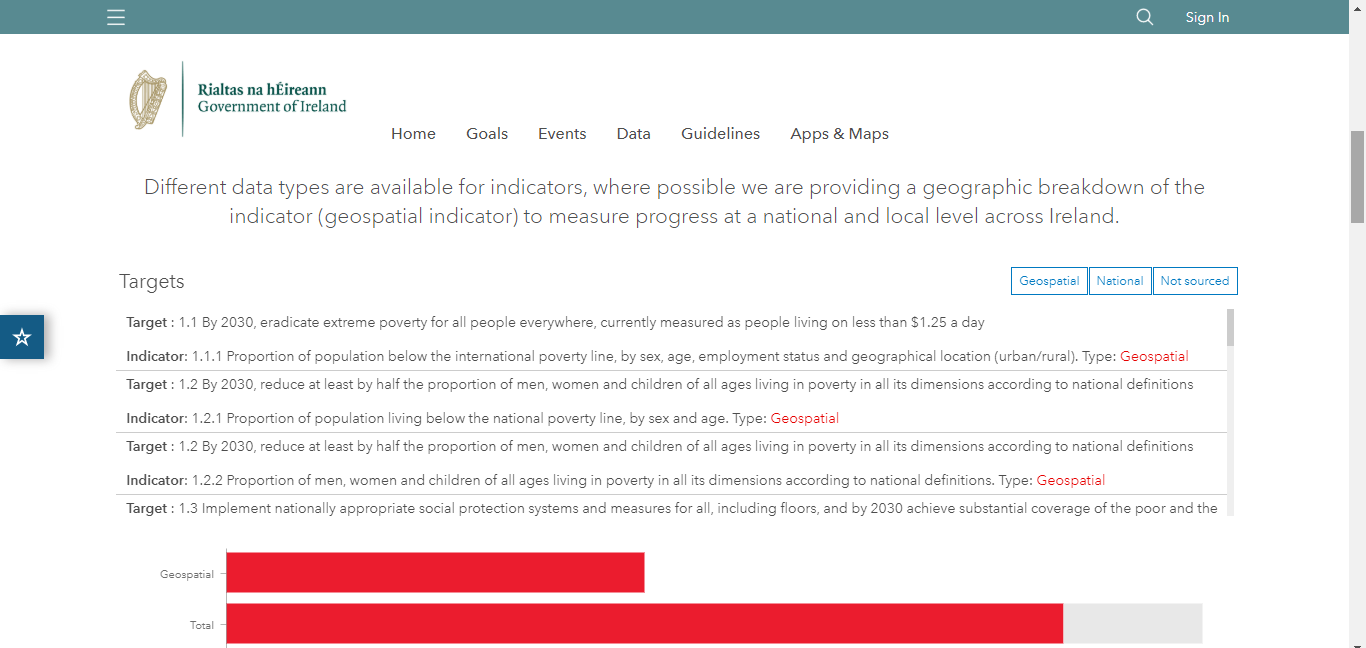
In other parts of the world, the Ireland national hub for Sustainable Development Goals developed an online platform that includes 100 layers of geo-statistical data, data visualization tools and web applications relating to their SDGs. Below is example of one goal explained in more detail.
Source: https://irelandsdg.geohive.ie/
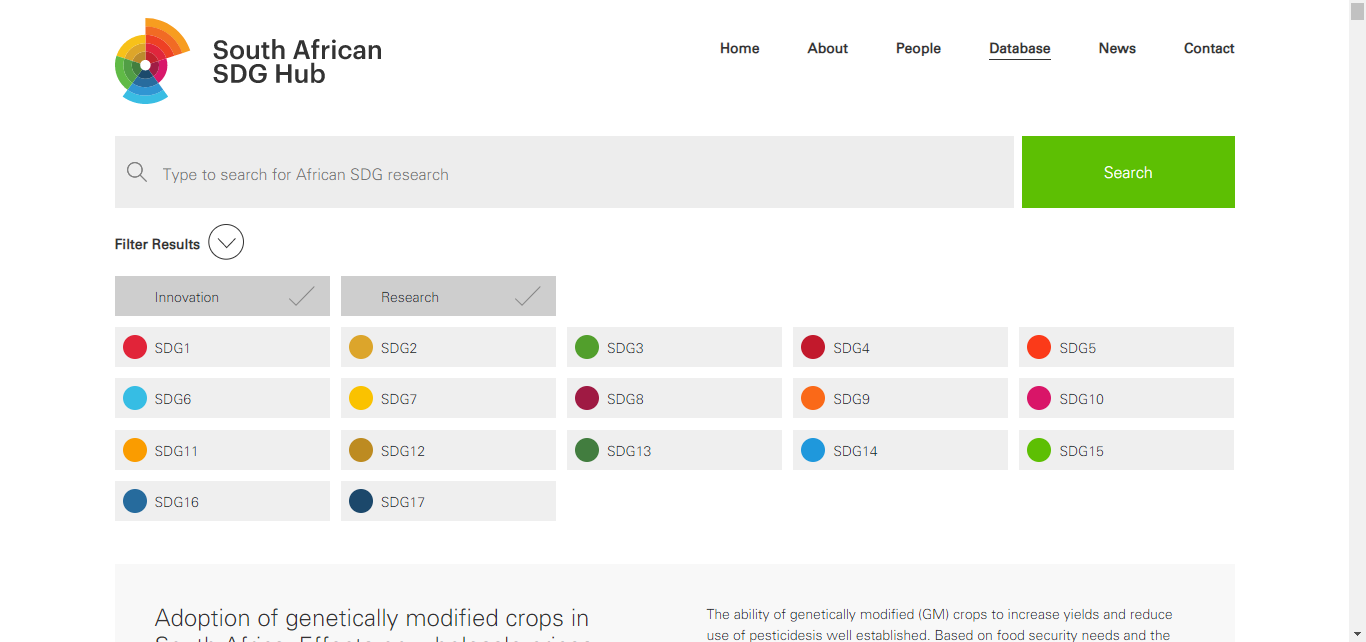
In South Africa, an SDG Hub was implemented to support the SDGs through providing useful knowledge resources, providing policy advice, promoting dialogue and building capacity.[4] The main users for this hub are government leaders, the private sector and the civil society at large.[5] In the database you can search for African SDG research done and this can be filtered by the SDG and whether research or innovation.
Source: https://sasdghub.org/resources/
The above hub shows the African SDG research however, it lacks some data visualisation elements and showing the progression of the goals as per country target. The examples shared are cases of how countries have used data visualisation to depict their SDGs achievement in their national plans.
Check out the examples and let us know what you think about how SDG data is visualised AND share other SDG data viz platforms or resources.[1]http://sdg.iisd.org/news/sdg-dashboard-enables-users-to-visualize-and-monitor-sdg-data/[2]https://www.sei.org/featured/visualize-sdg-interactions-colombia/[3] ibid
[4]https://sasdghub.org/about/[5] ibid[/et_pb_text][/et_pb_column]
[/et_pb_row]
[/et_pb_section]


 Optimized by Seraphinite Accelerator